Data unaudited. Charts may not equal 100% due to rounding. Performance results for TrustINdiana are shown net of all fees and expenses and reflect the reinvestment of dividends and other earnings. Many factors affect performance including changes in market conditions and interest rates and in response to other economic, political, or financial developments. Investment involves risk including the possible loss of principal. No assurance can be given that the performance objectives of a given strategy will be achieved. All comments and discussions presented are purely based on opinion and assumptions, not fact. These assumptions may or may not be correct based on foreseen and unforeseen events. The information presented should not be used in making any investment decisions. This material is not a recommendation to buy, sell, implement, or change any securities or investment strategy, function, or process. Any financial and/or investment decision should be made only after considerable research, consideration, and involvement with an experienced professional engaged for the specific purpose. Past performance is not an indication of future performance. Any financial and/or investment decision may incur losses.
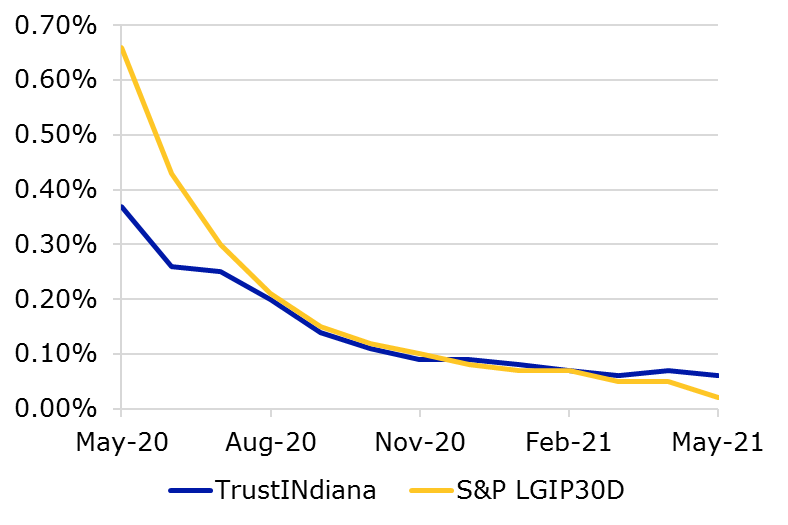
*The benchmark, the S&P US AAA & AA Rated GIP All 30 Day Net Yield (LGIP30D) is a performance indicator of rated GIPs that maintain a stable net asset value of $1.00 per share and is an unmanaged market index representative of the LGIP universe. The S&P benchmark utilized in this comparison is a composite of all rated stable net asset value pools. GIPs in the index include only those rated based on S&P’s money market criteria. Pools rated ‘AAAm’ provide excellent safety and a superior capacity to maintain principal value while those rated ‘AAm’ offer very good safety and a strong capacity to maintain principal value (Source: S&P Global Ratings). The comparison between this index and the portfolio may differ in holdings, duration, fees, and percentage composition of each holding. Such differences may account for variances in yield. Calculation methodology for the LGIP30D is the monthly average of the each week’s seven day average rate as provided by Bloomberg.